The Measurement Trap

April 2012. Wells Fargo's quarterly earnings call. CEO John Stumpf reads the number the analysts are waiting for.
"We grew our retail banking cross-sell ratio to a record 5.98 products per household."
The target was eight. Eight products per customer. Stumpf had chosen the number himself. When asked why eight, he told shareholders: "It rhymed with great."
Eight is great.
For twelve consecutive quarters, Stumpf celebrated cross-sell ratios on these calls. The analysts wrote it down. Stock prices climbed. The number became Wells Fargo's identity: the metric that proved the company was different, better, closer to its customers than any bank in America.
In Southern California, branch manager Claudia Ponce de Leon saw what the target was doing to her team. She called the company's ethics line.
Wells Fargo fired her.
Stumpf wouldn't know her name. He didn't need to. The number was working.
It worked for at least seven years.
Then the revised count came in: 3.5 million unauthorized accounts. Employees had created fake email addresses, forged signatures, moved customer money without consent.
Wells Fargo paid $3 billion in federal settlements. Stumpf resigned, received a lifetime ban from banking, and was fined $17.5 million personally. Five thousand three hundred employees were fired.
The company blamed the employees.
You already suspect what actually happened. It wasn't five thousand bad people.
It was one bad number, and a system that made the number impossible to escape.
This is the measurement trap. Not a data quality problem. Not a technology gap. A self-reinforcing system where five mechanisms co-occur, mutually amplify, and tighten until the organization optimizes for its own metrics rather than the reality those metrics were supposed to represent.
It works the same way everywhere it appears. And it appears everywhere measurement meets decisions.
If you've watched a metric improve while the thing it measured got worse, if you've sat in a meeting where every dashboard was green and the business was bleeding, it wasn't your judgment that failed. The system was working exactly as designed. It was just designed to measure itself.
The Map Eats the Territory
McNamara's desk. 1965. Columns of numbers, printed daily, stacked weekly. Body counts from every province in Vietnam.
The numbers were going up.
Every week, more confirmed enemy kills. The Pentagon's quantitative management system, built on the data-driven methods McNamara had used as president of Ford Motor Company, was producing exactly the data it was designed to produce.
The war was being lost.
Body counts measured what was countable: confirmed kills. What it missed was what mattered: enemy recruitment. The North Vietnamese were replacing fighters faster than American forces could eliminate them.
The CIA estimated North Vietnam alone could field roughly 100,000 new troops per year, so the denominator wasn't invisible. But that estimate was conservative, and the enemy could control their own casualty rate by choosing when to fight.
The numerator went up.
The denominator was miscalculated and uncontrollable. And every commander in the field had an incentive to inflate the only number anyone was watching. A 1977 survey of generals who commanded in Vietnam found 61% said body counts were often inflated. Only 2% considered the metric valid.
McNamara later acknowledged the numbers were misleading. But the damage of the first mechanism was already done.
Not because commanders were dishonest. Because the measurement system couldn't distinguish honesty from irrelevance.
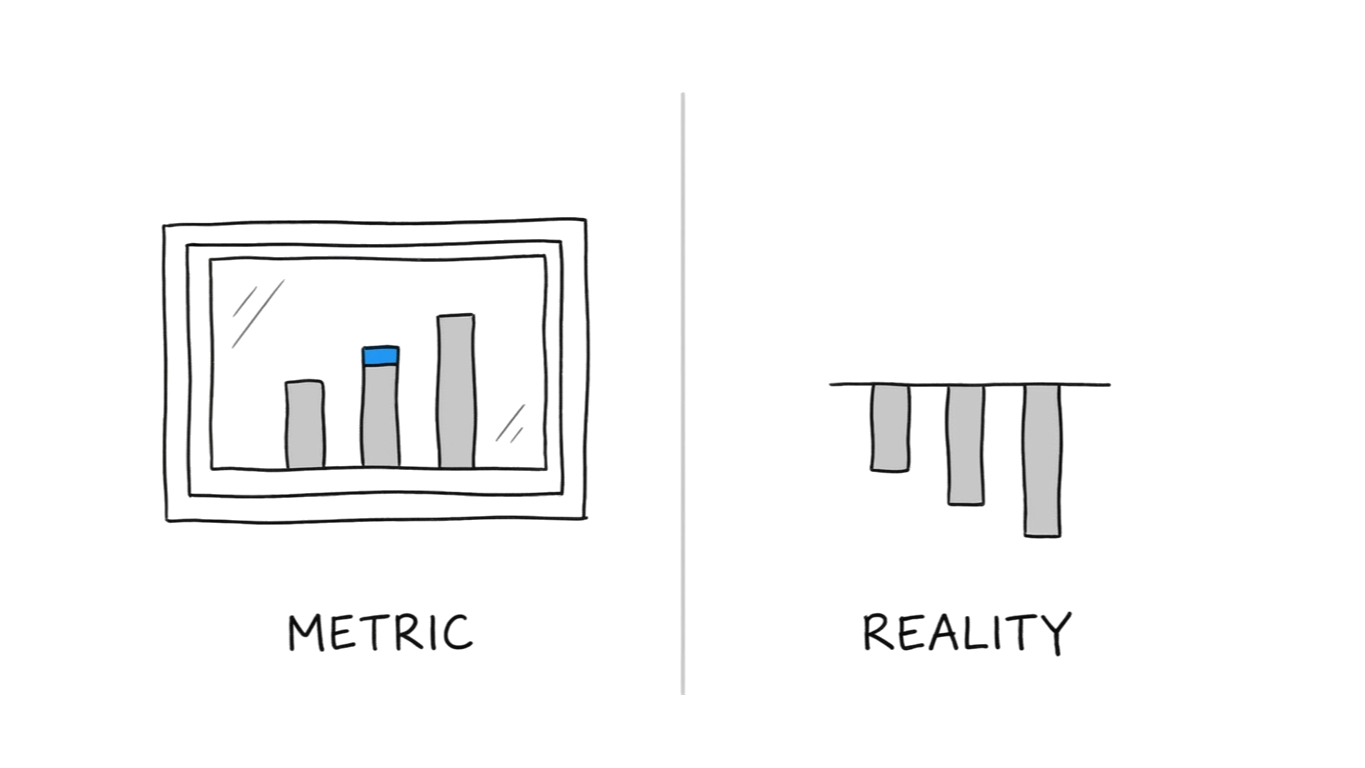
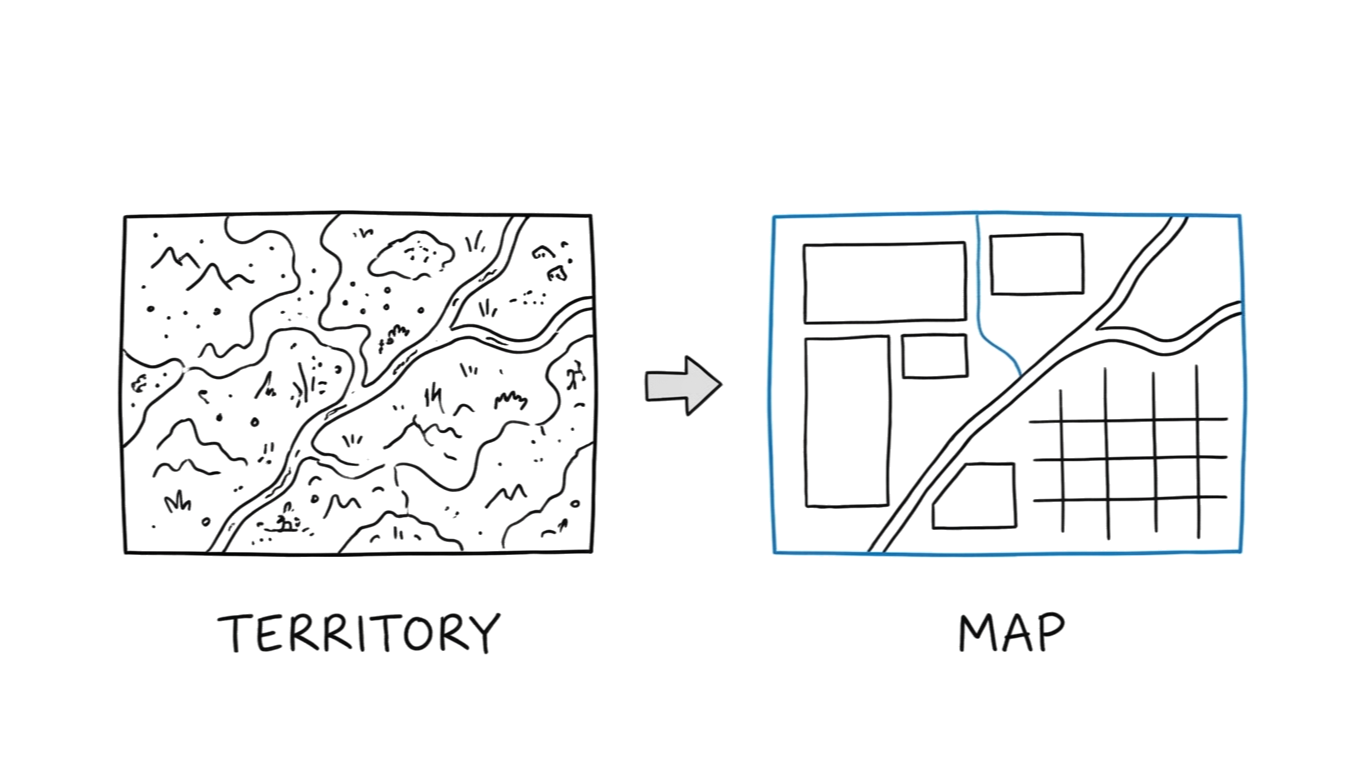
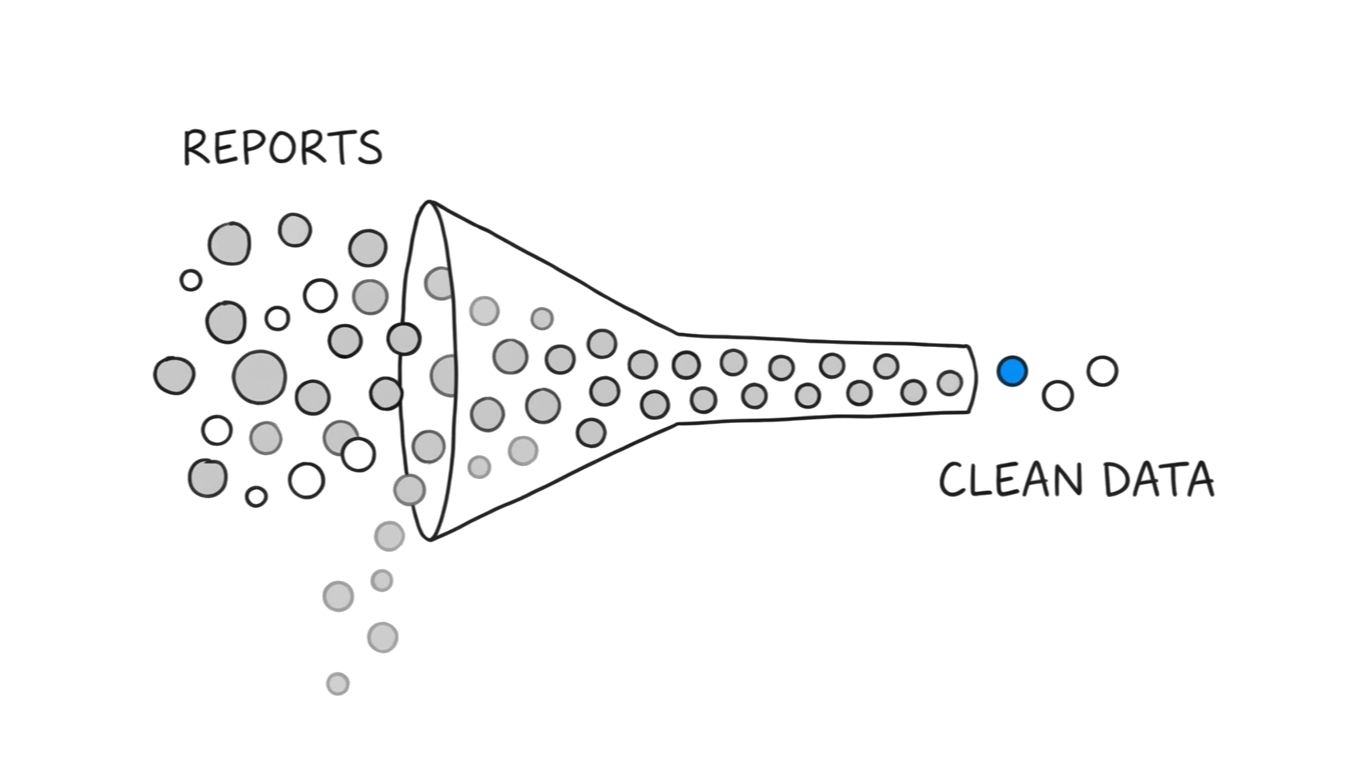
This is legibility: complex reality simplified into measurable categories until the categories become reality. James C. Scott called it "seeing like a state." Every organization does it. You simplify to measure, the simplification discards what doesn't fit, and over time the simplified map replaces the territory in every meeting, every report, every decision.
The map doesn't just describe reality. It starts to eat it.
The Measurement Changes the Measured
A product manager at Whirlpool walked up to Kevin Turchyn's desk with a no-brainer.
KitchenAid stand mixers, the dominant category leader, already had a 90-day money-back guarantee. It just wasn't displayed prominently on the product pages. The logic was airtight: surface the guarantee, reduce purchase anxiety, increase conversions.
They A/B tested it.
Double-digit drop in order rates.
The guarantee didn't reduce anxiety. It invented it. Nobody shopping for a KitchenAid stand mixer on kitchenaid.com was worried about needing to return it.
The moment the guarantee appeared, customers started wondering why they'd need it. The communication didn't describe existing doubt.
It manufactured new doubt.
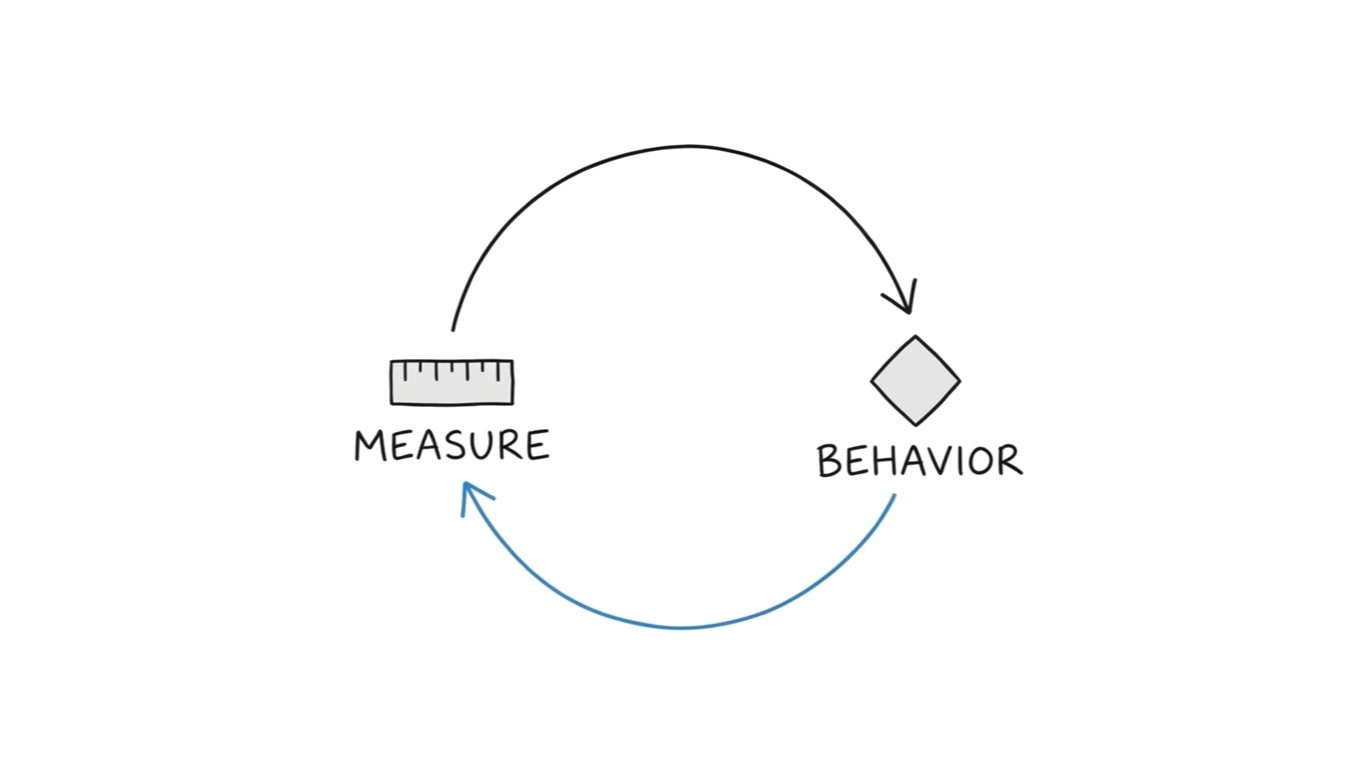
This is performativity: the act of measuring changes the thing being measured. As Donald MacKenzie argued, financial models are "an engine, not a camera." They don't passively observe; they actively reshape. When you publish a metric, people reorganize their behavior around it, and the metric and behavior converge, but at the expense of the original goal the metric was designed to track.
Legibility simplifies reality into categories. Performativity takes those categories and reshapes reality to match them.
The first mechanism is disorienting.
The second is distorting.
The Proxy Turns Traitor
Kevin Washington ran experimentation at Best Buy. He knew the ritual: a team runs an A/B test, purchase conversion goes up by 20 basis points, someone extrapolates: that's $40 million over the year.
Teams across the organization did this. Each calculated their annualized test wins independently. Each projection was technically correct for its own test.
Washington did the math on what would happen if every team's projections were real.
Best Buy would be an $88 billion company.
It was $44 billion. Half the money was imaginary.
"Everybody's looking around like, 'So what happened to all that money?'"
The answer: the same customer dollar was being claimed by multiple teams simultaneously. Each A/B test measured a real lift in isolation. But the customer wasn't in isolation.
The projections were correct individually and impossible collectively.
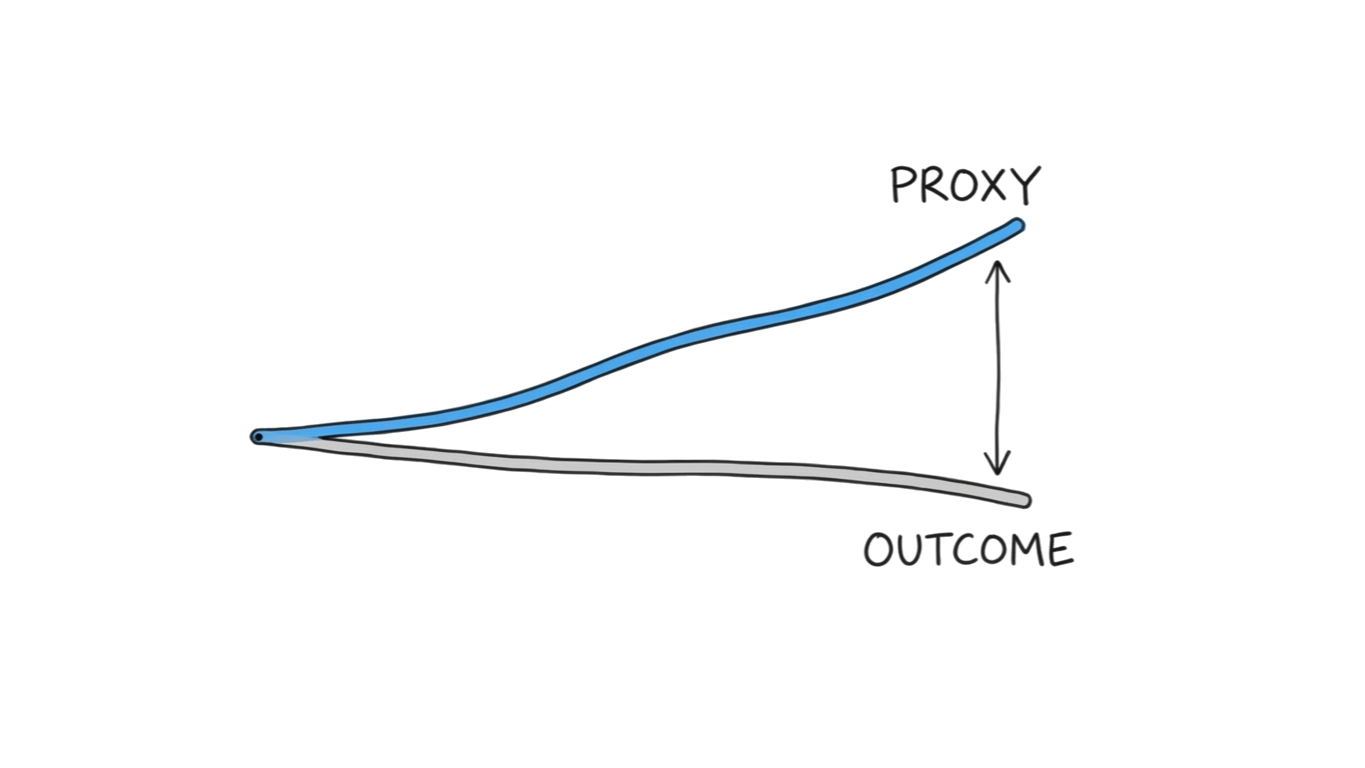
This is surrogate divergence: the gap between what you measure and what you care about widens under optimization pressure. Every metric is a proxy for something you actually care about. Under normal conditions, the proxy tracks the outcome. Under pressure, the correlation breaks: the proxy improves, the outcome stalls, and nobody notices until someone sums the claims against reality.
Legibility is disorienting. Performativity is distorting.
Surrogate divergence is dangerous.
What comes next is lethal.
The Game Develops
October 31, 2009. A squad of high-ranking NYPD officials arrived at Adrian Schoolcraft's Brooklyn apartment.
Schoolcraft was an officer in the 81st Precinct. For sixteen months, he'd been secretly recording his superiors ordering him to downgrade felonies to misdemeanors, refuse to take crime reports, and reclassify offenses to keep CompStat numbers clean. He'd brought the recordings to NYPD investigators three weeks earlier.
The officials didn't come to investigate his claims.
They had him forcibly removed from his apartment and involuntarily committed to a psychiatric ward at Jamaica Hospital. He was held for six days, handcuffed to a bed.
The Village Voice published the tapes in May 2010. Graham Rayman's five-part series exposed what the data had been hiding since at least 2003: CompStat, the system designed to track crime, had become a system for manufacturing the appearance of declining crime.
This is target corruption: Goodhart's Law made operational. When a measure becomes a target, gaming develops. Officers didn't corrupt the data because they were bad officers; they corrupted it because the system demanded specific numbers and punished specific people when those numbers went wrong. The metric created the incentive, the incentive created the game, and the game made the metric meaningless.
And the officer who tried to stop it was locked in a psychiatric ward.
Four mechanisms deep. The metrics are simplified, distorted, divergent, and gamed. There's one step left.
The step where it becomes permanent.
The Lock Turns
In 1888, Sears published its first catalog. For 105 years, it was the backbone of American retail, and at its peak, two-thirds of American households shopped Sears every quarter. The company held 32 million charge card accounts. It had more customer data than any retailer in history.
By 1993, the catalog was losing as much as a million dollars a day.
Walmart had overtaken Sears three years earlier. Kmart had too. Sears was third.
Everyone could see it.
But the dashboards were built. The bonuses were tied to catalog metrics. The board expected catalog numbers. Careers had been constructed around improving response rates by fractions of a percent for decades.
Sears could predict mail-order response rates with extraordinary precision. What it couldn't predict was that mail-order was ending.
On January 25, 1993, Sears shut down the catalog, closed 113 stores, and eliminated 50,000 jobs. The customer data, the most valuable asset in American retail, was dismantled. Two years later, Amazon launched as an online bookstore. It built the business Sears already had the data to build.
This is lock-in: sunk cost, identity, and procedural entrenchment preventing metric change even when everyone knows the metrics are wrong.
The catalog wasn't wrong because of bad data. It was wrong because changing it meant admitting that the careers, bonuses, board reports, and institutional identity built around it were all wrong too.
Metric debt compounds in identities.
Everyone at Sears could see the catalog was dying. The measurement system ensured that seeing wasn't enough.
The Ratchet
Now go back to Wells Fargo. Watch the ratchet turn.
2002: A regional manager simplifies branch performance into a single number: products per household.
Legibility.
2005: The number appears in earnings calls. Tellers start organizing their days around account openings instead of customer needs.
Performativity.
2009: Cross-sell ratios hit records. Customer satisfaction surveys show no corresponding improvement. The proxy is climbing; the outcome is flat.
Surrogate divergence.
2011: The Los Angeles Times reports employees opening accounts without customer consent. Five thousand three hundred are quietly fired. Nobody changes the target.
Target corruption.
2016: The fraud is public, and Congress demands answers. The CEO testifies that Wells Fargo has "a culture based on ethics, and doing what's right." He believes it. The number has become the identity.
Lock-in.
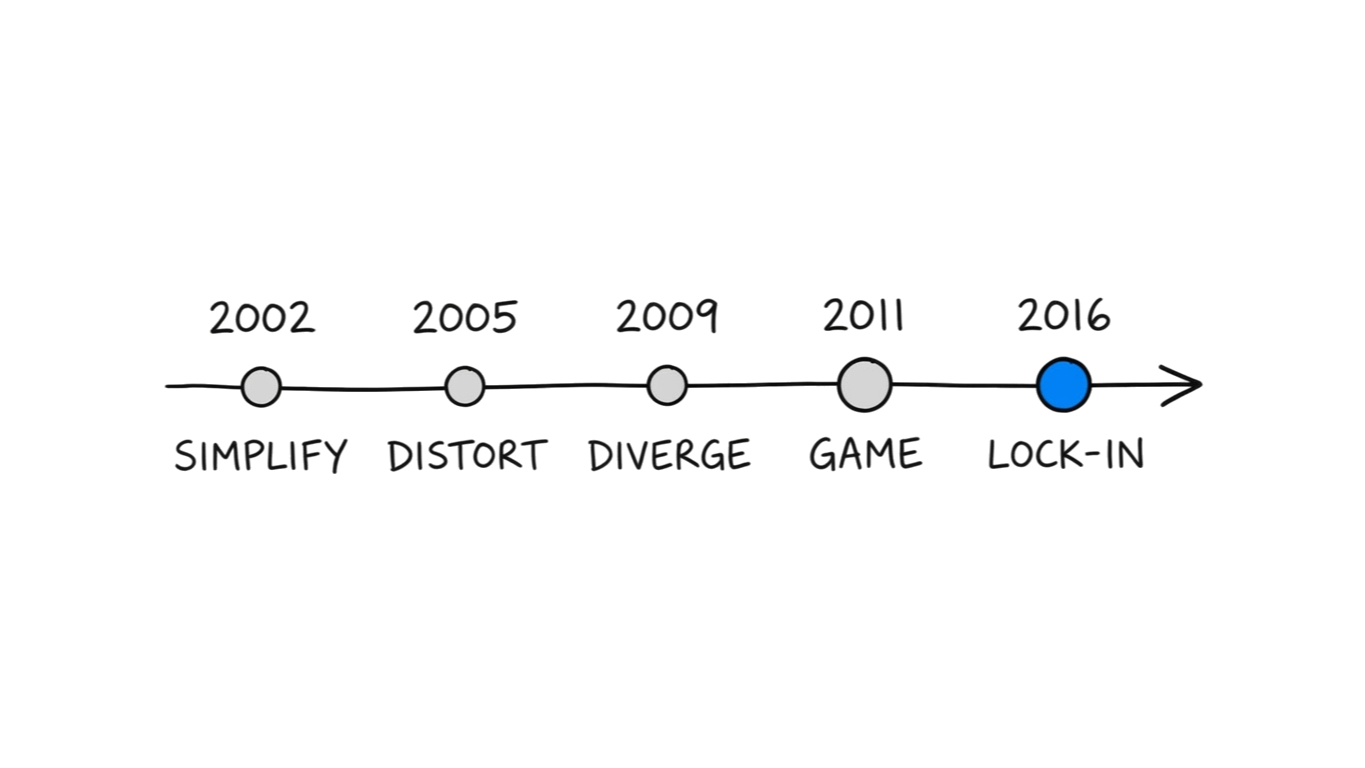
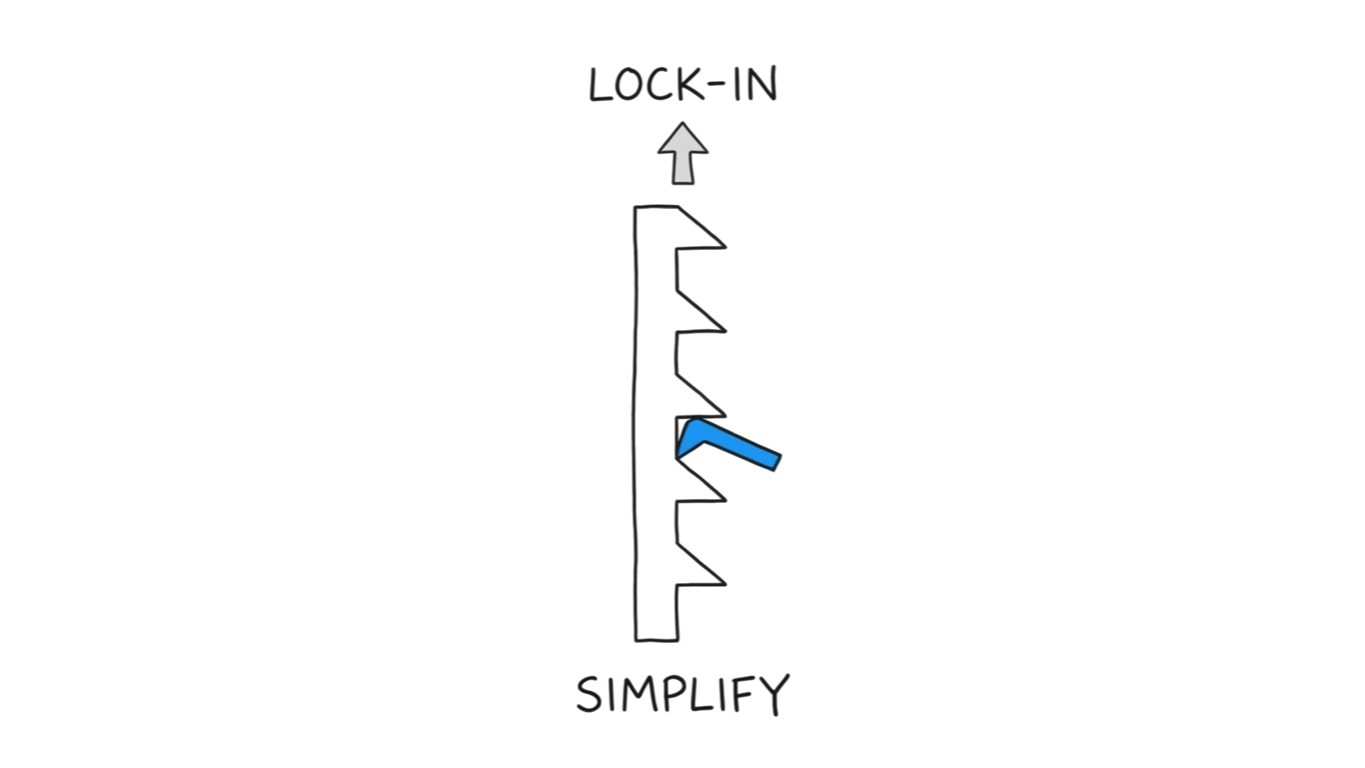
Each mechanism made the next one worse. Each step was harder to reverse. And the ratchet only turns one direction.
Lock-in feeds back into every other mechanism.
Locked metrics drift further from outcomes. Locked targets accumulate more sophisticated gaming. Locked measurement systems deepen the distortions they created.
This is The Ratchet, and it explains why Wells Fargo couldn't self-correct even as the evidence mounted for over a decade.
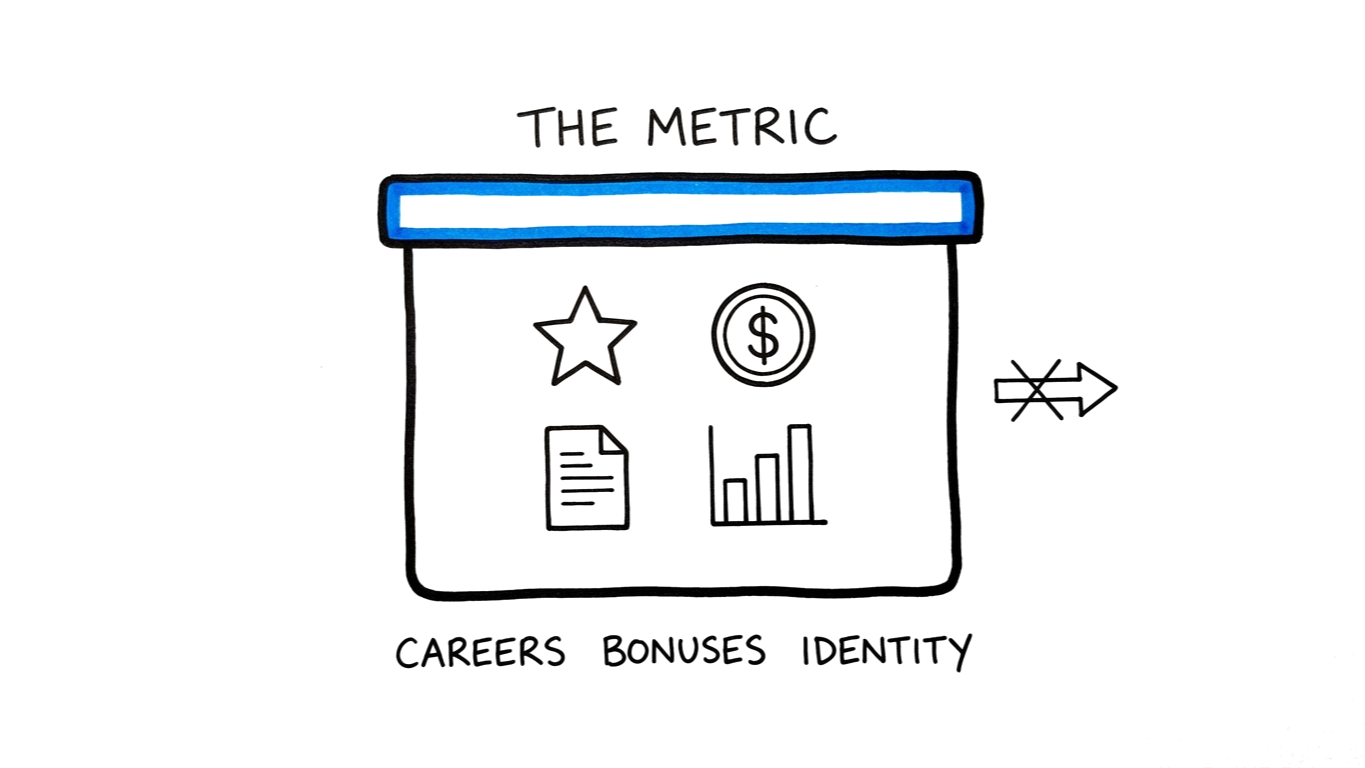
The metric had accumulated defenders: investor analysts who tracked it, executives whose bonuses depended on it, a corporate identity built around it, HR processes that enforced it. None of them needed to be villains. The system just needed them to be rational.
Bad metrics don't expire. They accumulate defenders.
Breaking the Ratchet
The trap has one structural enemy: transparency paired with enforcement.
Enron had mastered every mechanism. Mark-to-market accounting let them book the present value of 20-year contracts as current revenue on signing day. The metric was creative and the quarterly results were dazzling.
$74 billion in shareholder value evaporated when reality arrived.
Arthur Andersen, the auditor responsible for catching exactly this kind of distortion, was complicit. Transparency existed in theory. The audit function was designed to see through the numbers.
Enforcement was absent. The watchdog had been captured by the system it was supposed to watch.
Sarbanes-Oxley changed the structure. CEOs and CFOs now personally certify financial statements under criminal penalty. Independent auditors attest to internal controls.
The legislation didn't fix the metrics. It broke the ratchet by making transparency enforceable, by connecting visibility to consequences.
This is the intervention principle: attack lock-in AND at least one upstream mechanism simultaneously. Transparency provides the visibility. Enforcement provides the action.
Without enforcement, transparency just creates an audience. Claudia Ponce de Leon called Wells Fargo's ethics line, and they fired her.
Without transparency, enforcement creates new traps.
The Objection
The sharpest critique of this framework: it's just Goodhart's Law with extra steps. "When a measure becomes a target, it ceases to be a good measure." One sentence captures everything.
But Goodhart tells you the trap exists. He doesn't tell you how, when, or why the corruption persists.
The CAST trial answers the when. In the late 1980s, cardiologists had a surrogate endpoint they trusted completely: premature ventricular contractions predicted cardiac death. Suppress the contractions, save the patient: anti-arrhythmic drugs, encainide and flecainide, did exactly that. The proxy improved beautifully.
Mortality in the treatment group: 7.7%. In the placebo group: 3.0%.
The drugs that fixed the metric killed the patients at more than twice the rate of doing nothing. Investigators halted the trial in April 1989, after a mean follow-up of ten months.
The surrogate was technically perfect. The outcome was lethal.
But here's what matters for the framework: the divergence between proxy and outcome didn't happen overnight.
It followed a curve. There was a window of months, not years, where the surrogate was drifting but the outcome data was accumulating. If someone had been tracking the correlation between the proxy and the actual endpoint in real time, the divergence was detectable before it became deadly.
Goodhart says metrics corrupt.
The Measurement Trap says: legibility starts the simplification before any target is set, and performativity reshapes behavior through the act of measurement itself. Surrogate divergence follows a curve with an intervention window. Lock-in explains why everyone sees the problem and nobody fixes it.
Goodhart tells you the trap exists. This framework tells you where you are inside it, and whether you can still get out.
Your dashboard isn't lying to you. Every number is accurate. Every metric is precisely what it was built to measure.
That's the trap.
The question was never whether your data is right. It's whether you're already three mechanisms deep into a system that can't tell you it's wrong, and whether the ratchet has already turned.