The Silent Fill: Unlabeled AI Attribution
Your GA4 attribution report does not leave blanks.
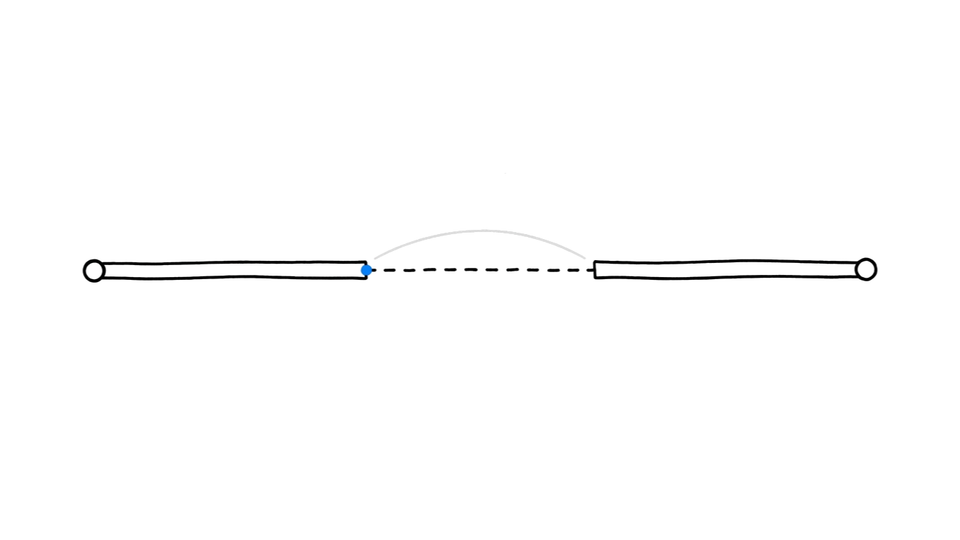
When a conversion path is missing data, GA4 does not show you a gap. It shows you a number. A plausible one. A number that a statistical model produced quietly in the background, filling what it could not measure with what it predicted should be there.
The dashboard looks clean because it was designed to look clean.
AI-generated attribution is indistinguishable from measured data for any exec reading a dashboard, when the model fills a gap it was never told exists.
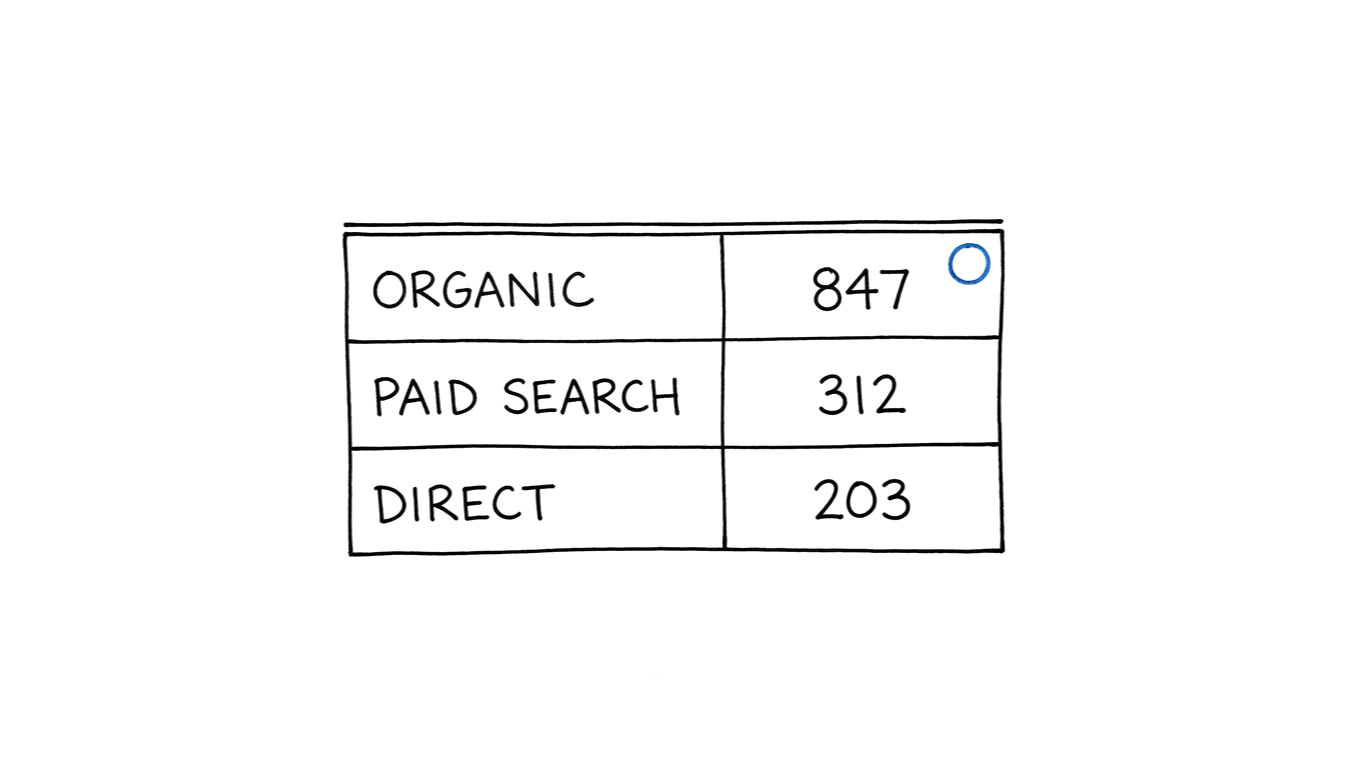
Before the Q1 board review, your demand gen director pulls the attribution report. Three of the top conversion paths show conversion counts that make sense for the quarter. Organic search, paid search, direct. All reasonable. She adds them to the slides. The board asks questions. She has answers. Nobody in the room knows those three paths are model-filled. There is no flag. There is no asterisk. The report looks exactly like a report built from measurement.
The problem is not that the model is wrong. The problem is that you cannot tell which parts of your report are measured and which parts are filled, without going somewhere most practitioners never look.
TL;DR
- GA4 fills attribution gaps with statistically generated numbers that appear in standard reports with no visible label
- The "modeled" indicator only appears in Attribution > Model Comparison, not in the daily Conversions report
- Most-affected touchpoints: last-click conversions, cross-device paths, assisted conversions from opted-out sessions
- Audit: Admin > Reporting Identity — "Blended" means modeling is active on your property
How AI-Generated Attribution Fills Invisible Gaps
Google Analytics 4 uses machine learning to model conversions from users who declined cookies.
When you enabled Consent Mode on your property, you told GA4 how to handle users who declined tracking. That was the right move. What Consent Mode does not do is disable conversion measurement for those users. It activates conversion modeling instead.
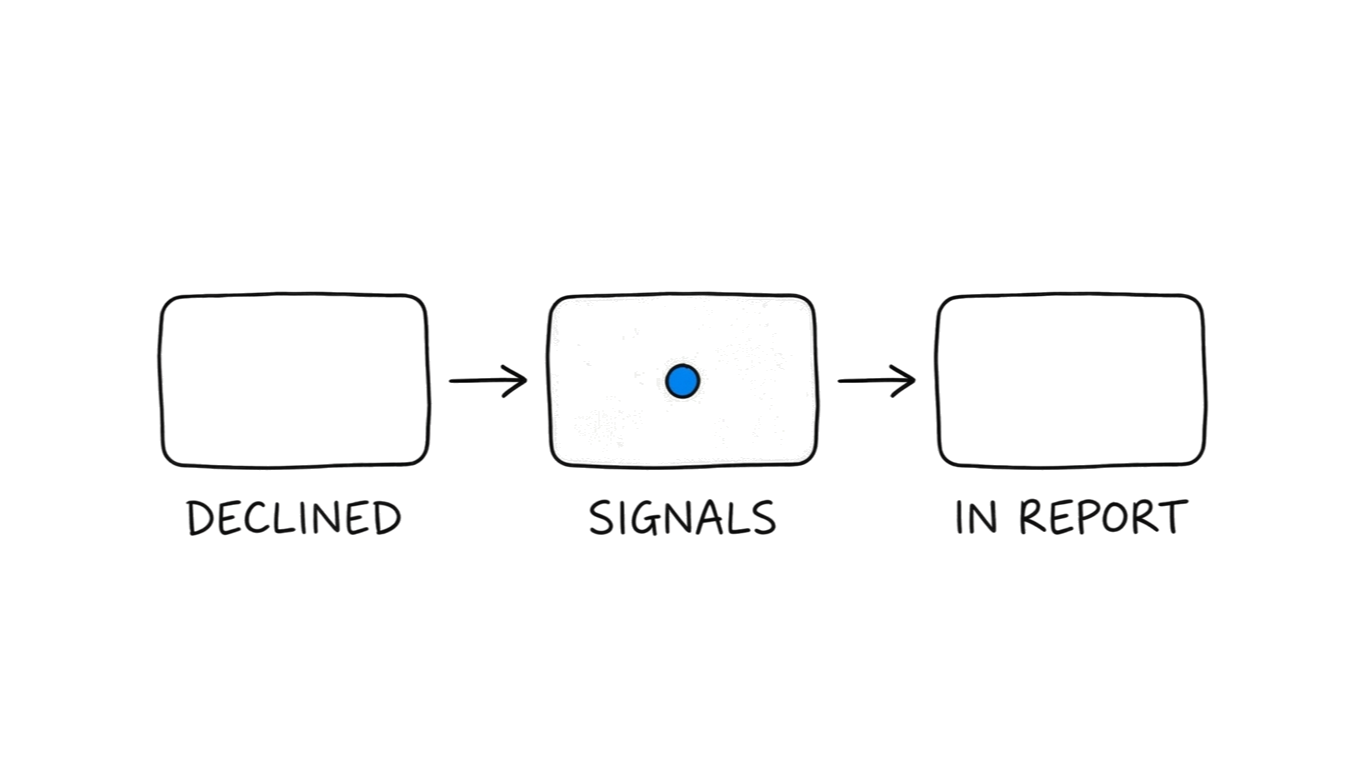
A user arrives from a paid search ad, declines cookies, and converts. GA4 cannot observe that conversion directly. So it observes that user's behavioral signals, device type, browser, session timing, referring source, and compares them to similar sessions from users who accepted cookies. It finds a statistical population of consenting users with matching signals who also converted. It assigns a fractional conversion credit to the opted-out session, based on that population's conversion rate.
That fractional credit is aggregated with your measured conversions. In your reports, it appears as a whole number.
No flag. No label. No asterisk.
The fill is invisible for three reasons. First, it happens at the platform level, not in your tagging. You did not add code to enable this. GA4 runs it by default when Consent Mode is active and the property's Reporting Identity is set to Blended. Second, the model is calibrated to your property's historical data, not a generic industry baseline. The output follows the statistical patterns of your real traffic. Third, the standard Conversions report aggregates modeled and measured conversions into a single total.
You set up Consent Mode because GA4 required it to maintain any conversion visibility as third-party cookies declined. That guidance was correct. What the documentation was quieter about was what would replace the lost conversions. According to Google's Consent Mode documentation, conversion modeling activates specifically to fill measurement gaps where consent for analytics is declined. The fill is the designed response to the consent signal, not a side effect.
Why AI-Generated Attribution Passes Dashboard Review
GA4's standard Conversions report aggregates measured and modeled conversions into a single total. Unless you are in the Attribution section of the interface, they are not separated. They are summed.
Pull up your daily Conversions report. The number you see is a combination of observation and inference, presented as a single fact.
The modeled indicator exists in GA4. Google did not hide the capability. But it lives in a secondary report that most practitioners visit once during setup and then forget. It is not in the daily Conversions report. It is not in the Looker Studio connector's default Conversions metric. It is not in the export your director sends to a slide.
The standard dashboard view was built for reporting clarity. The side effect is that it hides the seam between measurement and modeling.
The design is not a mistake. It is a tradeoff. You gain cleaner-looking reports in a cookieless environment, and you lose the instant ability to distinguish observation from inference in the same view.
The first consequence is interpretive. You read the conversion count as a measured fact. Part of it is a statistical prediction.
The second consequence is downstream. Reports built from that number, decisions made from those reports, and budget allocations made from those decisions are all built on a number that was partially generated.
This is the beneficiary question worth asking: who gains from modeled conversions appearing unlabeled in the standard view? Not you. You gain from knowing the split.
Which Attribution Touchpoints AI-Generated Data Fills First
Not every conversion in your report carries the same modeling risk. Some touchpoints are more susceptible based on how often the users in those paths decline cookies.
Last-click conversions from opted-out sessions. The most common. A user arrives, declines cookies, and converts. GA4 cannot observe the event directly and fills it. High-refusal markets, EU properties especially, see this as a meaningful share of last-click volume.
Cross-device conversion paths. A user researches on mobile with no cookies accepted, then converts on desktop with cookies accepted. The mobile touchpoint in the attribution path is modeled. The desktop conversion is measured. The path in your report looks unified. The first leg was filled.
Assisted conversions in multi-touch paths. When one or more touchpoints in a multi-step path come from opted-out sessions, those assists are modeled. The final click may be measured. The full path is not.
View-through conversions. View-through attribution, a conversion credited to an ad impression that was seen but not clicked, has the highest modeling rate. Impressions are harder to tie to individuals in a cookieless environment. The model fills more of the path.
The share of modeled conversions in your property depends on your consent acceptance rate. EU properties running standard consent banners typically see acceptance below 70%, leaving a meaningful share of conversion events with at least one modeled touchpoint.
What Makes AI-Generated Attribution Look Measured
The model is trained on your own property's data.
This is why modeled conversions are indistinguishable from measured ones. GA4 does not use a generic industry model. It uses a property-specific model built from the conversion behavior of your consented users.
The model learns: users with these characteristics who visit from these sources convert at this rate. When it fills a gap, it fills it with a value that matches the statistical patterns of your real traffic.
That means modeled conversions follow the same channel distribution as measured ones. If paid search drives 40% of your measured conversions, the modeled conversions from paid search approximate that share. If organic converts at a lower rate than paid, the model reflects that ratio.
The numbers look right. They look right because they were calibrated to look right. That is the design.
From the outside, a modeled conversion and a measured conversion share the same location (the Conversions report), the same formatting (an integer count), the same channel label (organic, paid, direct), and no visual differentiation in any standard view.
The only difference is the underlying source. Measured: a user event was observed and recorded. Modeled: a statistical prediction was generated and treated as an event.
Two rows that look identical in your report. One was observed. One was inferred. The report does not tell you which is which.
This is not a hallucination. A hallucinated value would be wrong in a detectable way. A modeled conversion is designed to be right in a way that is indistinguishable from measurement. Those are different failure modes. Most audit processes are built for the first one.
How Executives Read AI-Generated Attribution as Fact
The board room version of this problem is the one that compounds.
Your demand gen director is presenting Q1 attribution. She ran the right reports. GA4 showed her conversion counts broken down by channel. The numbers were consistent with Q4. The channel mix made sense. She put them in the deck.
What she did not know: the GA4 property had Consent Mode enabled since last April, when a compliance update triggered a banner implementation. Reporting Identity was set to Blended, the default. A meaningful share of the conversions in the report were model-filled, not measured.
She presented the numbers. The board discussed channel mix. One exec asked why direct was up. She had an answer, a podcast mention in February. The answer was plausible. The number it was answering may have been partially generated.
The executive layer receives data in its final form: a dashboard screenshot, a slide export, a pre-formatted report. They are furthest from the raw GA4 interface. Even if the Model Comparison report existed and showed the split, that split would not survive the journey to a board slide.
The org makes decisions from those slides. Budget is allocated. Channels are credited. Performance is benchmarked against those numbers.
This is how AI-generated attribution compounds. Not in one corrupted report but in the accumulated weight of decisions made from clean-looking aggregates. Each decision that treats a modeled number as a measured fact creates a downstream decision built on the same ground.
The compound effect is quiet. The reports look fine at every step.
Why Standard Detection Methods Miss AI-Generated Attribution
The standard analytics audit is designed to catch the wrong kind of problem.
A typical GA4 audit checks for: conversion event duplication, tag firing on the wrong pages, session inflation from bot traffic, channel grouping misconfigurations, and self-referral loops. These are measurement errors. The frame is: something fired that should not have.
Modeled conversions are not measurement errors. They are intentional fills. They are supposed to be there. They pass every measurement validation because they were built to pass.
The hallucination frame does not apply here. Hallucinations produce plausibly wrong output — a company name that does not exist, a date that is impossible. Modeled attribution produces plausibly correct output. The values are realistic. They fit the distribution. They make sense when you look at them. Looking at them is not enough to detect them.
Period-over-period comparison fails for the same reason. If your property has had Consent Mode active for six months, your comparison periods both contain modeled data. The ratio of modeled to measured is relatively stable. The trend looks real.
Anomaly detection fails. The anomaly is not in the numbers. The anomaly is in what the numbers represent. You are looking for a signal that the data was built not to emit.
What catches it is going somewhere you probably have not looked recently: the Attribution reports, the Reporting Identity setting, the Model Comparison view. These were not part of standard audit templates before conversion modeling became widespread. They are relevant now. The audit template did not update when the platform did.
How to Audit AI-Generated Attribution Before It Compounds
Three checks. None require a developer.
Check 1: Confirm whether modeling is active.
Admin > Property > Reporting Identity.
If the setting is "Blended," the default for most properties, conversion modeling is active. If it is "Observed," only measured conversions appear in reports.
Most properties that ran a Consent Mode implementation in the past two years are on Blended. Most practitioners inherited this setting without configuring it.
Check 2: Quantify the modeled share.
Advertising > Attribution > Model Comparison.
Compare the "Data-Driven" and "Last click" attribution models. Look for a breakdown labeled "Modeled" versus "Observed." The divergence between these columns is your modeling signal.
If the Advertising section is not visible, your property may need Advertising features enabled. That is a separate toggle in Admin > Property > Property Settings.
Check 3: Spot-check high-risk conversion paths.
Pull the top ten conversion paths in Attribution > Paths.
Note which paths carry significant volume from sessions likely to have high cookie refusal: EU traffic, iOS Safari, Firefox with strict privacy settings. These are the paths most likely to contain modeled touchpoints. A path that is heavily weighted toward those segments and shows unusually high conversion volume is worth examining against Check 2.
Check 4: Audit Meta Advantage+ modeling exposure.
Meta runs a similar modeling layer for Advantage+ campaign attribution. In Meta Ads Manager, go to Settings > Attribution Setting. If Advantage+ Data-Driven Attribution is active, Meta is generating a portion of your conversion attribution rather than measuring it directly. Standard campaign reporting does not flag which conversions are modeled.
What to do with the result.
You are not trying to eliminate modeling. In a cookieless environment, modeling fills real gaps. The goal is to know the ratio and disclose it when attribution data reaches stakeholders.
"We have 847 conversions in Q1. A portion are modeled based on our property's Blended reporting identity. The channel mix is directionally accurate. The absolute numbers carry a modeling margin."
That disclosure changes nothing about the strategy. It changes everything about the trust placed in the number.
Before you run this audit, you probably assume your attribution is measured. After you run it, you will know what it actually is.
Most practitioners land in the middle: a property they did not configure from scratch, running defaults they inherited, producing reports they trust because the numbers look right. The numbers look right because a model trained on your own data was built to make them look right.
That is not a failure. It is a tradeoff you made without knowing you made it. You followed the Consent Mode guidance. You kept your conversion data alive through the cookie transition. The model was part of that deal.
The practitioner who runs this audit is not the paranoid one. They are the one who walks into the next board review knowing which numbers are measured and which are filled. That distinction used to live in the tag. Now it lives in a reporting identity setting that most dashboards never surface.
The dashboard does not leave blanks. It never did. Now you know where to look for the fills.